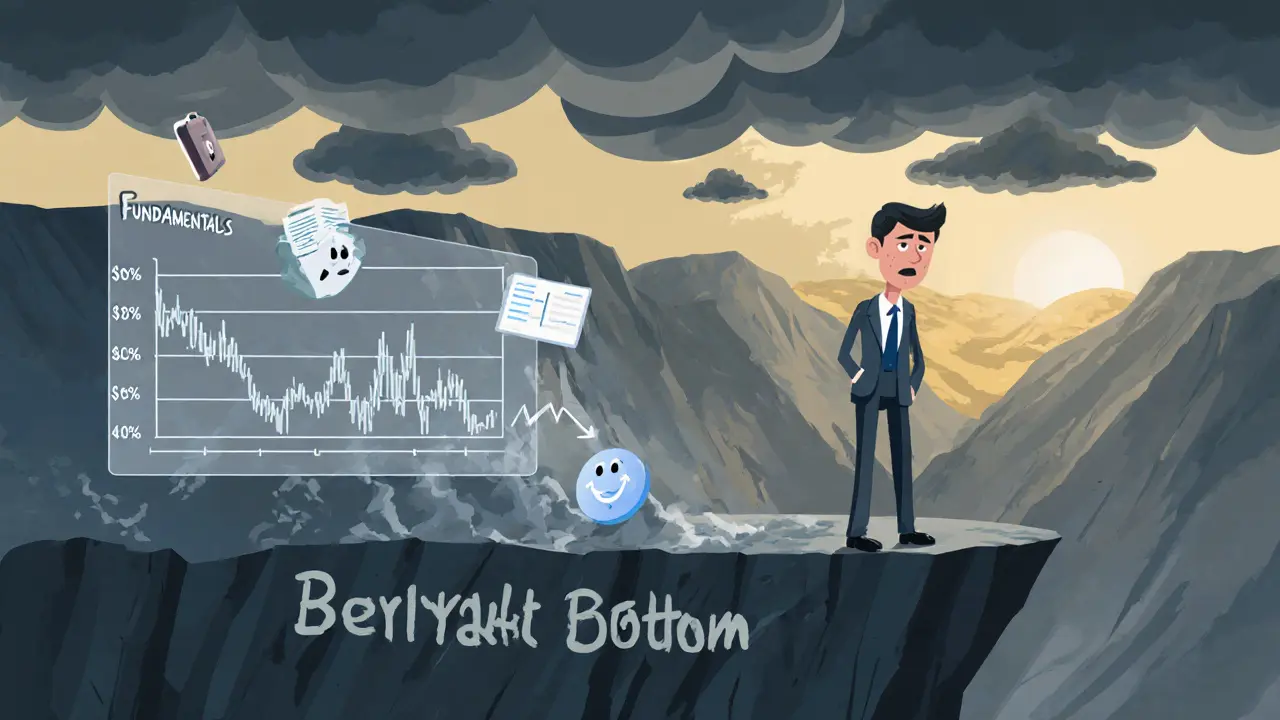
When working with market bottom indicators, signals that suggest a market has hit its lowest price level and may reverse upward, traders get a clearer view of when to consider buying. Also known as technical indicators, quantitative tools derived from price and volume data, and on-chain metrics, blockchain data points like hash rate, transaction count, and fee levels, these signals work together with market sentiment, the collective mood of investors reflected in news, social chatter, and regulatory updates to paint a picture of a possible bottom. In short, market bottom indicators encompass technical analysis, on‑chain data, and sentiment cues, each influencing the other as a market winds down.
Technical indicators give you a quick read on price patterns. Things like the Relative Strength Index (RSI) show whether an asset is oversold, while Moving Average Convergence Divergence (MACD) flags momentum shifts. When RSI dips below 30 and MACD lines cross upward, the odds of a bottom increase. On‑chain metrics add a layer that price charts alone can’t capture. A sudden drop in transaction fees, a rise in active addresses, or a spike in hash‑rate often precedes price rebounds because miners and users are re‑entering the network. Pair those data points with market sentiment, which you can gauge from social media trends, regulatory news, and airdrop announcements. Positive sentiment bursts—like a new “crypto consumer protection law” in Australia or an exciting airdrop—can lift fear and fuel buying pressure, helping confirm the bottom signaled by the other two signals. In practice, traders who line up an oversold RSI, a healthy rise in active addresses, and upbeat news stories tend to catch the early upside more reliably than those who rely on a single metric.
Understanding how these elements interact gives you a practical toolkit for navigating volatile phases. Below you’ll find deep‑dive articles that break down each indicator, walk through real‑world examples, and show how to blend them into a cohesive strategy. Whether you’re tracking Bitcoin’s block time, analyzing DeFi yield farming trends, or monitoring regulatory shifts in India, the collection offers actionable insights that help you spot a market bottom before the rally begins.

Learn how to identify a bear market bottom using earnings, yield curve, sentiment and technical signals, plus a step‑by‑step checklist for investors.