Bear Market Bottom Detection Tool
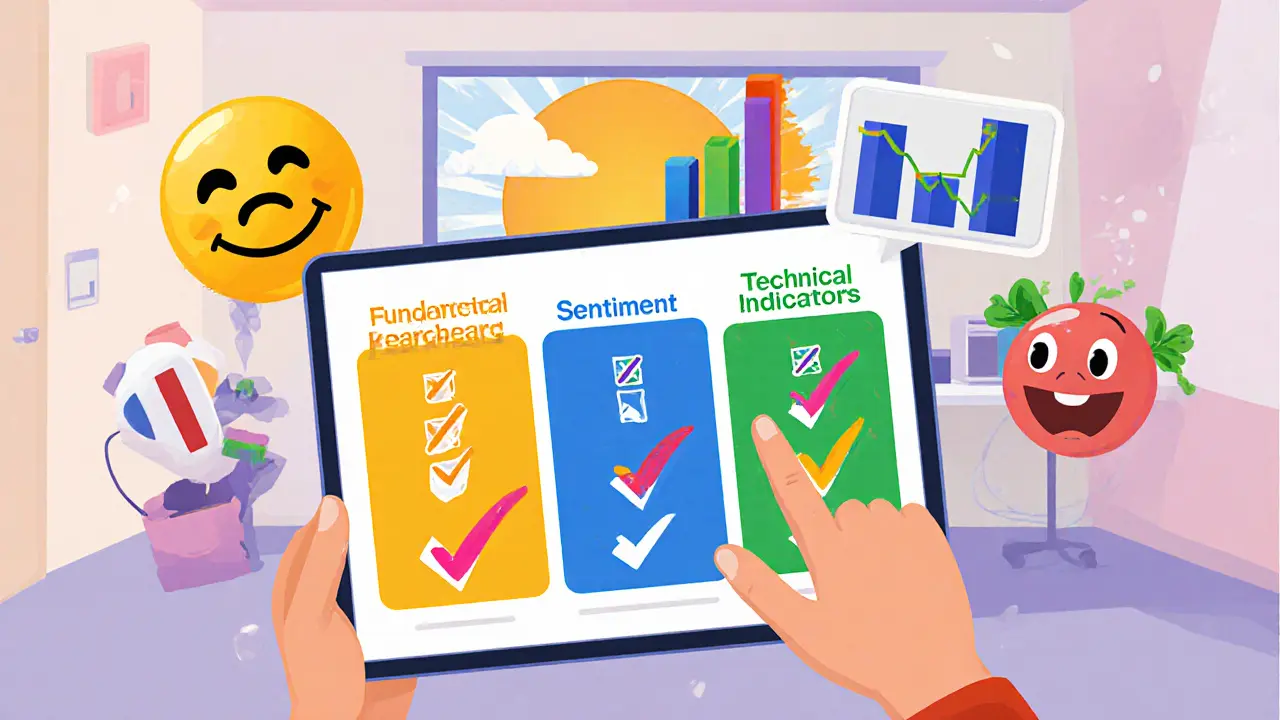
Fundamentals
Economic drivers and corporate performance
Sentiment
Investor psychology and market mood
Technical Indicators
Chart patterns and market behavior
Market Bottom Analysis Results
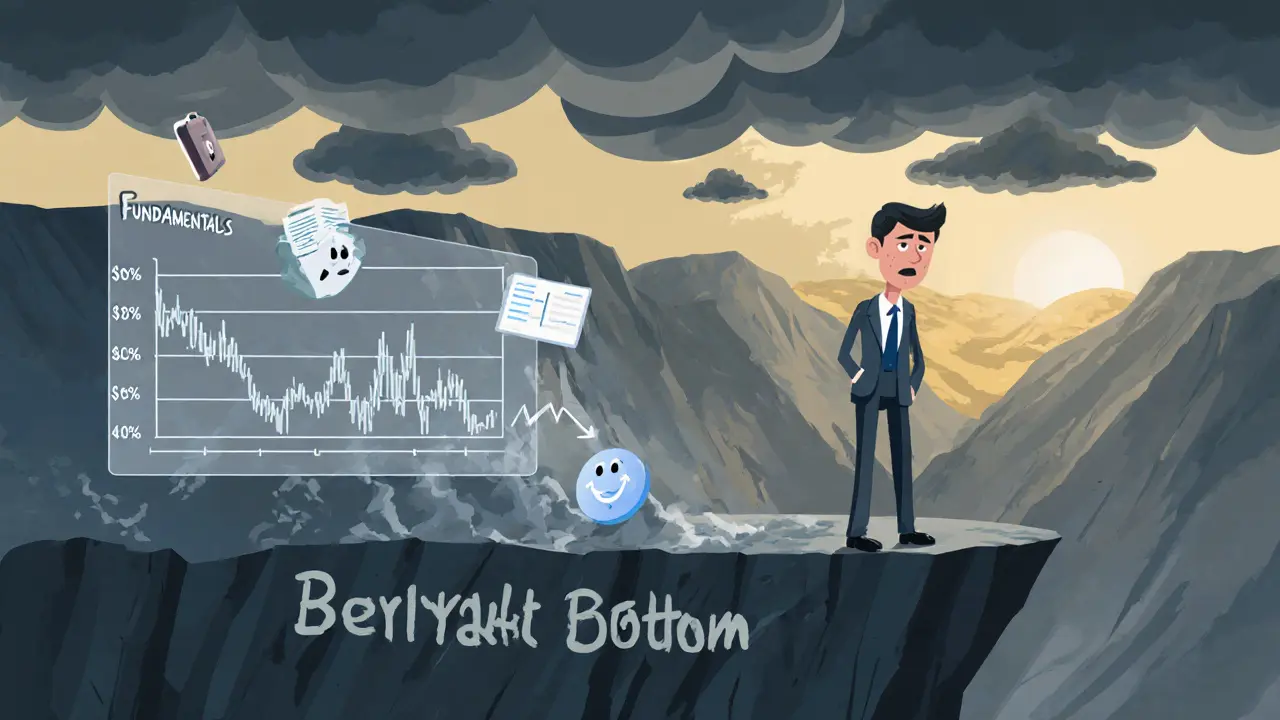
When the market has been dragging down for months, investors start asking, “Is this the end?” Recognizing a bear market bottom is tricky, but missing it can cost you dearly. Below you’ll find a practical playbook that blends data, sentiment, and charts so you can tell when the downside is finally over.
Key Takeaways
- A bear market bottom is the lowest price point before a sustained rally, usually after a 20%+ decline.
- Look for convergence across three groups: fundamentals (earnings, yield curve), sentiment (pessimism, capitulation), and technical cues (volume spikes, breadth).
- Non‑recessionary bears tend to be shallow and short (≈‑22% drop, 3months); recessionary bears are deeper and linger (≈‑35% drop, 18months).
- No single indicator guarantees a bottom-use a checklist and stay disciplined.
What Exactly Is a Bear Market Bottom?
Bear market bottom is a the point at which a prolonged market decline stops falling and begins a lasting upward trend. It marks the transition from a bearish regime to a recovery phase and is typically defined by a 20% or greater drop from recent highs that then reverses.
The bottom isn’t a single day; it’s a zone where multiple metrics start turning positive together. Treat it like a traffic light turning green for investors who have been waiting on the other side.
Fundamental Signals That Hint at a Bottom
Fundamentals give you the economic “why” behind price moves. Here are the most reliable pieces of the puzzle.
Corporate Earnings
Corporate earnings are a primary driver of equity valuation, reflecting a company’s profitability over a quarter. When earnings have been falling for several quarters and then start to plateau or rise, it often precedes a market bottom. An earnings recovery signals that businesses are stabilizing, which boosts investor confidence.
Revenue Growth
Revenue is harder to manipulate than earnings, so a slowdown followed by a pick‑up is a strong bottom indicator. Look for quarter‑over‑quarter revenue growth returning to at least break‑even levels across major sectors.
Yield Curve Dynamics
Yield curve plots interest rates across different maturities, with the 10‑year Treasury as a benchmark. In every recessionary bear market since 1950, the curve has been inverted (short‑term rates higher than long‑term). The moment the curve starts to normalize-short rates falling or long‑term yields rising-often lines up with a market bottom.
Inventory and Demand Patterns
When businesses hold excess inventory while consumer demand dips, it creates a double‑whammy for profits. A turning point comes when inventory levels start to shrink and demand metrics (like retail sales) show revival. This shift indicates that the economy is shedding excess capacity, a classic bottom sign.
Monetary & Fiscal Policy
Monetary policy refers to central‑bank actions that influence interest rates and money supply and fiscal stimulus together shape the bottom’s timing. An easing stance-lower rates, quantitative easing, or a fiscal deficit‑to‑GDP rise-can accelerate the transition from bear to bull.
Sentiment&Psychology: The Extremes That Matter
Investor mood is a contrarian compass. During a bottom, sentiment hits rock bottom: panic selling, headlines of “the end of the market,” and very low participation rates.
Capitulation Volume
Look for a dramatic spike in trading volume on down days-the market’s way of saying “enough is enough.” After that spike, volume often shifts to the upside on modest price gains, showing that institutions are quietly accumulating.
Surveys & Media Tone
Metrics like the AAII sentiment survey or the Consumer Confidence Index usually reach their lowest points right before a bottom. When news coverage turns overwhelmingly bearish, it can be a green light for contrarian investors.
Technical Clues That Confirm the Bottom
Technical analysis isn’t a crystal ball, but it can help confirm fundamental and sentiment signals.
Market Breadth
Breadth measures the number of advancing stocks versus declining ones. A rising “advance‑decline line” after a prolonged decline suggests broader participation in the recovery.
Price Momentum
Momentum oscillators (like the RSI) that move out of oversold territory (<30) and stay there for several weeks can indicate that the selling pressure is easing.
Valuation Metrics
Valuation metrics such as price‑to‑earnings (P/E), price‑to‑book (P/B) and dividend yield often reach historically low levels at a bear market bottom. While low valuations alone don’t guarantee a rally, they set the stage for “value” investors to step in.
Recessionary vs. Non‑Recessionary Bears: A Quick Comparison
| Attribute | Recessionary Bear | Non‑Recessionary Bear |
|---|---|---|
| Median drawdown | ≈‑35% | ≈‑22% |
| Average duration | ≈18months | ≈3months |
| Yield curve state | Inverted | Usually flat or mildly steepened |
| Typical catalyst for bottom | Policy easing + fiscal stimulus | Corporate earnings rebound |
Putting It All Together: A Bottom‑Recognition Checklist
- Confirm the market has fallen at least 20% from its recent peak.
- Check for a consecutive quarter of improving corporate earnings or at least a halt in earnings decline.
- Observe the yield curve-has it started to flatten or steepen upward?
- Look for a capitulation volume spike followed by rising volume on up‑days.
- Assess sentiment surveys-are they at historic lows?
- Verify that technical breadth and momentum indicators are turning positive.
- Compare current valuation multiples to historical averages; are they markedly lower?
- Ensure at least three of the above signals are aligning within a 4‑week window.
If you tick most of these boxes, the odds are you’re near a bear market bottom. Remember, it’s a probability game-not a guarantee.
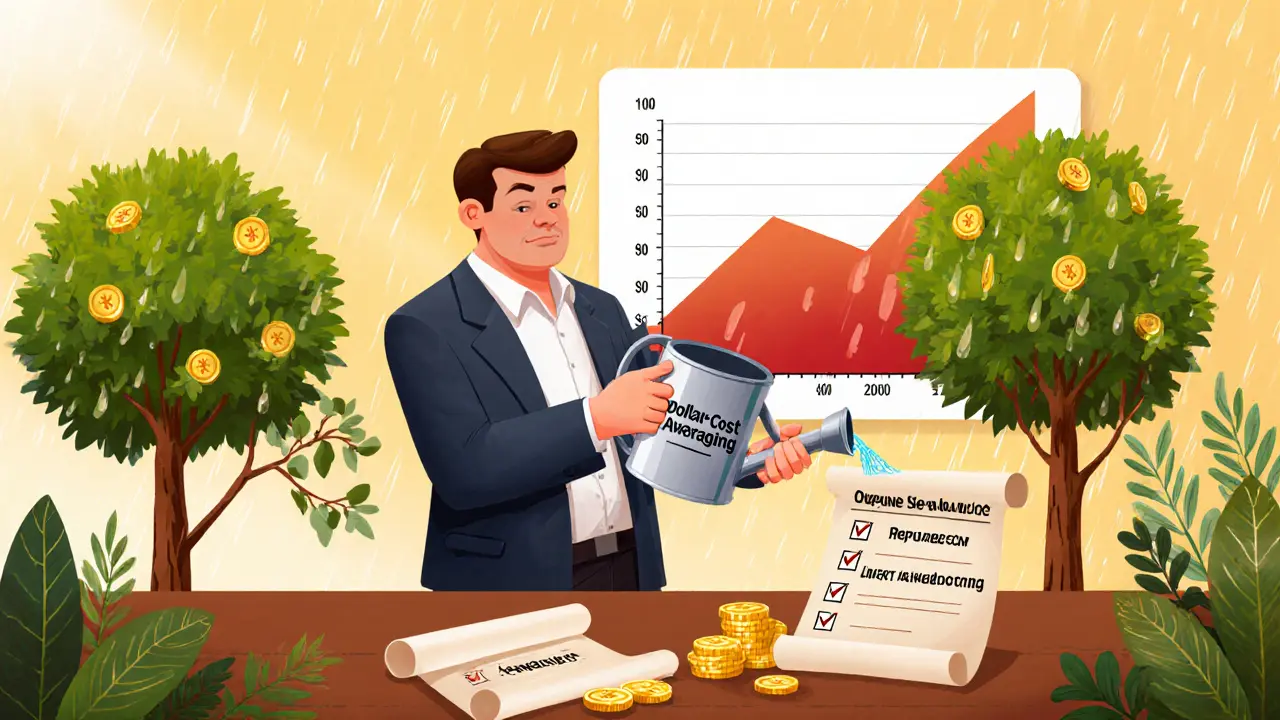
How to Act When the Bottom Appears
- Re‑balance, don’t panic. Shift a portion of cash into high‑quality equities that have become cheap.
- Set staggered entry points. Use a dollar‑cost‑averaging plan to smooth out remaining volatility.
- Keep an eye on macro‑policy. If central banks start tightening again, it could stall the recovery.
- Stay disciplined with stop‑losses. Even at a bottom, some sectors may keep falling.
Next Steps & Ongoing Monitoring
Even after you spot the bottom, keep the dashboard open. Markets can wobble for months before a solid up‑trend kicks in.
- Update your earnings calendar quarterly and watch for earnings surprises.
- Track the 10‑year Treasury yield weekly; a rising trend often confirms recovery.
- Monitor consumer sentiment and retail sales reports for continued demand strength.
- Review breadth and volume charts monthly; a widening advance‑decline spread signals broader participation.
The goal isn’t to catch the exact low- it’s to position yourself early enough to benefit from the upside while protecting against prolonged declines.
Frequently Asked Questions
How long does a bear market bottom usually last?
The bottom phase itself can be brief-often a few weeks to a couple of months-while the overall recovery may take six months to a year to become sustained. Duration varies widely between recessionary and non‑recessionary bears.
Can I rely on a single indicator to time a bottom?
No. History shows that every indicator-earnings, yield curve, sentiment, or technical-fails on its own. A convergence of at least three signals gives the highest confidence.
Do bear market bottoms always come after an inverted yield curve?
All recessionary bears have featured an inverted curve, but non‑recessionary bears often occur without a clear inversion. Look at the curve’s trend rather than a single snapshot.
Should I sell all positions before a bottom hits?
Selling into a falling market locks in losses. Most studies show that staying invested and gradually re‑balancing yields better long‑term returns than trying to time the exact bottom.
What role do algorithmic trades play in modern bear market bottoms?
Algorithms can accelerate both declines and rebounds, creating sharper spikes in volume. This makes capitulation cuts more pronounced, but the underlying fundamentals still drive the true bottom.


Peter Schwalm
Really solid breakdown here. I’ve been watching the yield curve closely since last fall-when the 10-year dipped below the 2-year, I thought we were done for. But the moment it started flattening again in March, I started nibbling at tech ETFs. Not going all-in, but small positions. Now that earnings are stabilizing and retail volume’s drying up, I’m starting to think we’re in that zone. Not saying it’s over, but the signs are aligning better than they have in 2 years.