When working with bear market, a prolonged period where crypto prices fall 20% or more from recent highs. Also known as downtrend, it signals risk‑averse strategies for traders. A bull market, the opposite phase where prices rise steadily for months often follows a bear market, creating a full market cycle. Understanding crypto market cycles, the recurring sequence of bull, bear, and consolidation phases helps you time entries and exits. Finally, technical analysis, the study of price charts, volume, and indicators to forecast moves provides the tools you need to spot the early signs of a downturn.
First, look at price action on the daily and weekly charts. A series of lower highs and lower lows is a classic pattern that bear market recognition encompasses. When the 50‑day moving average crosses below the 200‑day moving average, the "death cross" often precedes a sustained decline. Volume also matters: rising sell‑side volume while price drops indicates strong conviction among bearish participants.
Second, monitor sentiment indicators. Social media buzz, Google search trends, and the Fear & Greed Index shift sharply toward fear as investors panic. During a bear phase, the fear level stays above 60% for weeks, and new high‑frequency traders start short‑selling more aggressively. This sentiment shift influences both retail and institutional behavior, reinforcing the downtrend.
Third, evaluate macro factors. Regulatory news—like stricter crypto laws in India or new consumer protection rules in Australia—can trigger market-wide sell‑offs. Likewise, macro‑economic data such as rising inflation or higher interest rates often push risk‑on assets like Bitcoin into a bear stance. These external forces are part of the broader crypto market cycles and can accelerate the downturn.
Finally, use technical indicators to confirm the pattern. The Relative Strength Index (RSI) dropping below 30 signals oversold conditions, but in a bear market it can stay low for an extended period. The Moving Average Convergence Divergence (MACD) turning negative and the Average True Range (ATR) expanding suggest increasing volatility, a hallmark of bearish phases. Combining these signals creates a robust framework for bear market detection.
By weaving together price patterns, sentiment shifts, macro events, and technical tools, you develop a reliable method to recognize a bear market early. This multi‑layered approach ensures you aren't relying on a single data point, which can be misleading during chaotic market moves.
Now that you know how to spot the signs, the next step is handling the bear phase effectively. Position sizing becomes critical—reduce exposure on highly correlated assets and keep a portion of your portfolio in stablecoins or cash equivalents. Consider hedging with futures or options if you have the skill set; these instruments can offset losses when prices keep falling. Diversify across sectors—while Bitcoin may slump, some DeFi tokens or gaming NFTs could hold relative strength, offering opportunities even in a down market.
Risk management also means setting stop‑loss orders based on technical levels rather than arbitrary percentages. For example, place stops just below a recent swing low or a key support zone identified by Fibonacci retracement. This way, you protect capital while allowing enough room for short‑term volatility. Moreover, keep an eye on liquidity—during a bear market, order books thin out, and slippage can erode profits quickly.
Finally, stay informed about upcoming events that could change the market direction. A major protocol upgrade, a new exchange listing, or a favorable regulatory announcement can spark a short‑term rally even amid a longer downtrend. Treat these catalysts as potential entry points, but always assess them through the lens of your overall bear market strategy.
Armed with these insights, you’re ready to navigate the next market phase with confidence. Below you’ll find a curated collection of articles that dive deeper into how to analyze price charts, manage risk, and spot opportunities when the market turns bearish. Explore them to sharpen your skills and stay ahead of the curve.

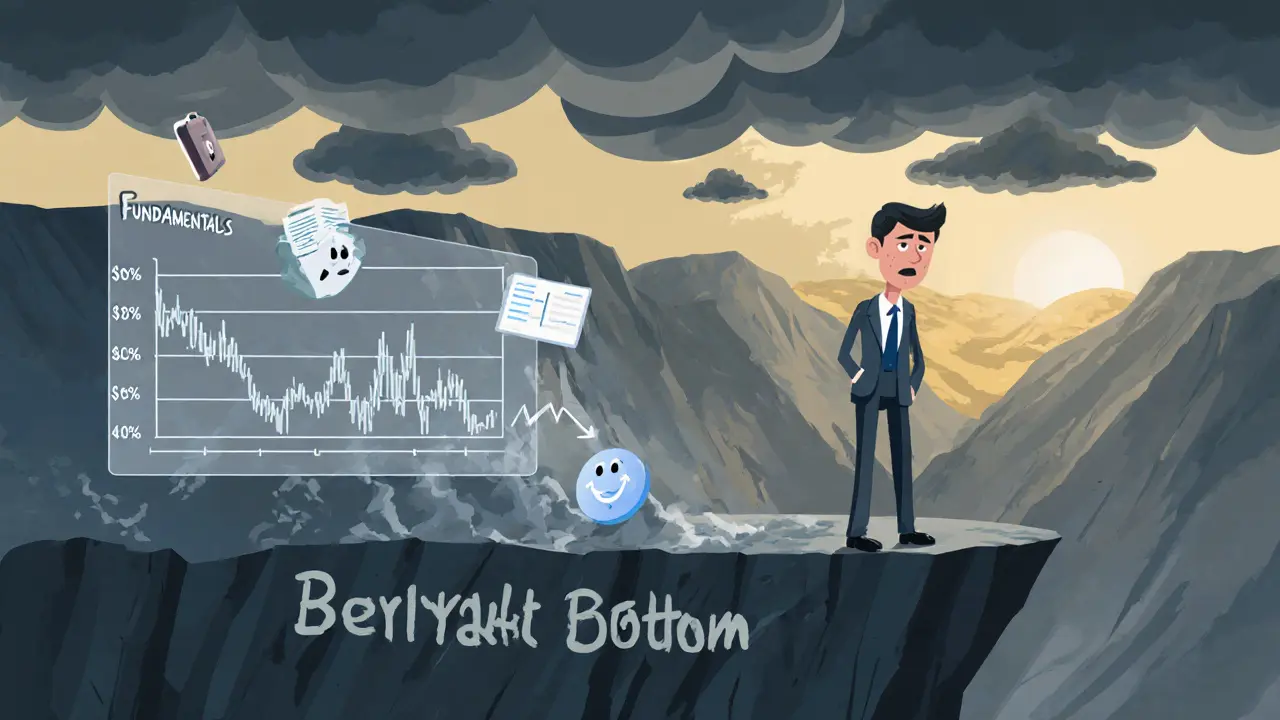
Learn how to identify a bear market bottom using earnings, yield curve, sentiment and technical signals, plus a step‑by‑step checklist for investors.